
1. Check full-cycle RMS
Repeated acceleration can overload a 10 A class drive even when base current is much lower. Use RMS across the whole cycle and the actual temperature derating curve.
Current methodScreen joint current, cooling and fit.
Cycle RMS + heat estimate. Assumed parameters; verify with supplier.
Compared with an illustrative 10 A cycle-RMS reference and 80/95°C review targets. These are not supplier limits. Peak capability and temperature derating remain unknown.
7.12 A
29% margin to 10 A example
47.1°C
Rise 12.1°C; drive heat only
3.46 W
GaN 3.46 / Si 4.62 W; same load cycle
259.2 A²s
Not joules; allowable pulse limit unknown
Implied repetition period: 8.00 s; recovery: 7.20 s.
Next step: verify a specific drive model
For an outside result, reduce load/duty or improve cooling first. For all results, obtain the supplier’s current, thermal and protection curves.
Email inputs & resultContact options and required documents10A robot joint servo drive application review Illustrative calculator screening only; no product approval. DC bus voltage: 48 V Base phase current: 4.5 A RMS Burst phase current: 18 A RMS Burst duration: 0.8 s Time at burst current: 10 % Local ambient temperature: 35 °C Assumed junction-to-ambient resistance: 3.5 K/W Example stage: gan Outcome: Within example targets — verification required Whole-cycle phase RMS: 7.12 A Modeled drive loss: 3.46 W Modeled junction temperature: 47.1 °C (drive heat only) Pulse current-squared integral: 259.20 A²s (allowance unknown) Assumptions: GaN 12 mΩ / 100 kHz / 10 ns / 0.8 W aux / 0 nC Qrr; Si 16 mΩ / 20 kHz / 45 ns / 1.2 W aux / 80 nC Qrr. Please confirm actual current convention, hot resistance, peak duration/repetition, derating, encoder ports, fieldbus and safety documentation for the proposed model. Motor datasheet, torque-speed cycle and housing CAD: to be supplied.
Repeated acceleration can overload a 10 A class drive even when base current is much lower. Use RMS across the whole cycle and the actual temperature derating curve.
Current methodAn A²s integral does not establish peak capability. Ask for the vendor’s current convention, overload curve, initial temperature and recovery interval.
Required evidenceGaN can support high PWM rates, but losses depend on components, layout and operating point. Compare matched conditions rather than assuming a fixed reduction.
EPC reference designOutput sensing helps observe gear twist. Encoder resolution does not guarantee arm accuracy or remove mechanical compliance.
Gear engineering dataA common DC bus can share power only when other loads or the supply can accept it. Size the remaining energy path for worst-case braking.
Braking-resistor guidanceSTO does not hold a gravity load or provide electrical isolation. A 10 A label, dual encoder or ordinary brake output establishes no SIL/PL certification.
STO operating guidanceThis page concerns selecting a drive for a robotic joint; it is not a datasheet for a named stock unit. Mechanical fit, torque-speed capability and procurement details remain model-specific.
On smaller screens, scroll the table horizontally.
| Decision | Established here | Unknown until model selection | Next action |
|---|---|---|---|
| Current definition | 10 A is the example cycle-RMS reference | Actual continuous, phase crest and burst limits | Request ratings with cooling, temperature and duration |
| GaN vs silicon | Both can implement a motor inverter | Efficiency, dimensions and acoustic noise | Compare measured loss maps at matching voltage/current/PWM |
| Donut vs rectangle | Both are packaging approaches | Bore, mass, connectors and keep-out | Use supplier drawings and assembled-joint CAD |
| Embedded vs cabinet | Moves power electronics and cooling responsibility | Total harness cost, service access and EMI | Budget integration and validation costs, not PCB price alone |
| Product availability | This page is a selection guide | Model, lead time, price, sample stock and certificates | Obtain a model-specific written quotation |
The calculator is a two-level repeating current model. Ib and Ip are phase RMS within the base and acceleration intervals; D is the fraction of time at Ip. The input ranges are numerical screening bounds, not rated operating limits.
Icycle = √[(1 − D) × Ib² + D × Ip²]
Iavg = (1 − D) × Ib + D × Ip
Pulse integral = Ip² × duration (A²s)
Cycle period = duration / D, when D > 0
Tj,model = Tlocal + Pdrive,avg × Rθ
At 0% burst duty, only Ib contributes and the burst integral is zero. At 100%, Ip is continuous and there is no cooling interval. Both zero current and 0°C are valid. Sinusoidal phase crest is √2 × RMS; compare vendor current conventions before using an overload curve.
The screening reference is 10 A cycle RMS. The 80°C review band and 95°C ceiling are illustrative design targets, not device limits. No temperature derating curve or peak-current approval is available in this model. An outcome within the example targets still requires model-specific verification.
GaN example: Rds = 12 mΩ, f = 100 kHz, effective switching time = 10 ns, Qrr = 0 nC, auxiliary power = 0.8 W. Silicon example: Rds = 16 mΩ, f = 20 kHz, time = 45 ns, Qrr = 80 nC, auxiliary power = 1.2 W. These are editorial assumptions, not values verified for an EPC or GSD board. Default Rθ = 3.5 K/W is also hypothetical.
The simplified model omits temperature-dependent resistance, output-capacitance loss, deadtime/reverse-conduction loss and detailed current waveforms. It cannot predict motor winding, rotor, lubricant or skin-contact temperature.
On smaller screens, scroll the table horizontally.
| Term / simplified equation | GaN, W | Silicon, W | Interpretation / uncertainty |
|---|---|---|---|
| Conduction: 3 × Icycle² × Rds | 3.600 | 4.800 | Assume fixed Rds; actual hot resistance must be measured |
| Switching approximation: 3 × f × V × Iavg × tsw | 1.440 | 1.296 | Simplified overlap model; not a measured switching-energy map |
| Recovery approximation: 3 × f × Qrr × V | 0.0000 | 0.2304 | No reverse-recovery term assumed for GaN; other switching losses remain |
| Auxiliary power | 0.800 | 1.200 | Fixed illustrative logic and gate-drive allowance |
| Total drive-only heat | 5.8400 | 7.5264 | Motor and gearbox heat excluded; no universal savings percentage |
[epc] EPC9173 Quick Start Guide, revision 1.0 (2022-05-23) shows a real reference inverter under documented test conditions. Its ratings and measurements are not transferred to this calculator.
Sealed joints need a designed heat path from the board through its interface and housing to the surrounding environment. A fanless cavity does not establish a universal thermal resistance. Contact area, mounting pressure, interface material, motor heat and gearbox friction all matter.
Higher PWM can reduce current ripple for a given inductance, while increasing some switching losses. A simplified single-leg 50% duty estimate is ΔIpp ≈ V/(4fL). At 48 V and 25 µH, that gives 24 A peak-to-peak at 20 kHz or 4.8 A at 100 kHz. Actual three-phase modulation and back-EMF change this result; it cannot demonstrate absence of rotor heating or demagnetization.
Measure current ripple, motor temperature and closed-assembly thermal soak before accepting a low-inductance pairing. The EPC9173 guide documents a 100 kHz test with 50 ns deadtime; it does not establish a universal sub-20 ns GaN specification. [epc] EPC9173 Quick Start Guide, revision 1.0 (2022-05-23)
A motor encoder supports commutation and motor-side control; an output encoder measures link angle after the gearbox. The second measurement can support correction, but elastic twist and resonance remain. Gear size alone cannot establish a motor envelope or corrected arm accuracy.
On smaller screens, scroll the table horizontally.
| Decision | Useful principle | Required data | Validation action |
|---|---|---|---|
| Torque transmission | Motor torque × ratio × efficiency is an initial estimate | Gear model, load/speed, efficiency and torque limits | Check holding, acceleration and emergency loads separately |
| Elastic twist | K1/K2/K3 describe load-dependent stiffness [gear] | The selected model’s stiffness and bearings | Budget link deflection before tuning |
| Output encoder | Observes load-side angle | Resolution, calibration, latency and mounting error | Validate loaded position error; bits are not accuracy |
| Nested loops | Motor and load feedback serve different dynamics | Supported firmware and resonance behavior | Measure stability margins; do not promise zero backlash |
[gear] Harmonic Drive HFUS Engineering Data, V02 (12/2018) describes the stiffness regions. Use the exact gear model’s curves rather than assigning universal values to frame sizes.
On smaller screens, scroll the table horizontally.
| Architecture | What it provides | Confirm before integration | System test |
|---|---|---|---|
| EtherCAT / CoE | Distributed clocks support coordinated sampling [ethercat] | Actual CSP/CSV/CST modes, master period and watchdogs | Measure synchronization and end-to-end command latency |
| CANopen / CANopen FD | Drive behavior and transport profiles are distinct [cia] | EDS/DCF, supported PDOs, bitrate, termination and bus load | Test deadline misses and recovery with every node active |
| Vendor CAN FD | A physical/data-link capability | Documented command protocol and synchronization scheme | Do not assume CiA 402 compatibility |
| RS-485 / Modbus | A possible configuration or supervisory channel | Device register map and timing guarantees | Use for motion only when requirements are demonstrated |
Distributed-clock accuracy, communication period and torque response are separate measures. Confirm the full controller-to-actuator timing budget and behavior after a missed frame. [ethercat] EtherCAT Technology Group: technology overview, section 1.5 · [cia] CAN in Automation: technical document catalog
Capacitor absorption between two voltages is E = ½C(Vmax² − Vstart²). For an illustrative 120 µF between 48 V and 56 V, E = 0.04992 J. A 3.9 Ω resistor at 56 V sees V²/R ≈ 804 W while switched on. Neither value establishes a usable braking system; size pulse energy, average power, recovery, supply sink capacity and hardware voltage limits. [regen] Schneider Electric: rating the braking resistor
No model-specific GSD safety certification, hardware STO topology, brake capability or reaction time is established by this page. Request the exact variant’s safety documentation. SIL/PL performance is not implied by a function name or dual-channel drawing.
On smaller screens, scroll the table horizontally.
| Function | Intended role | Limit / common misuse | Evidence needed |
|---|---|---|---|
| STO | Inhibit motor torque generation [sto] | Stop motion instantly, hold against gravity, or isolate power | Exact safety manual, certificate, response and reset behavior |
| SBC / holding brake | Safety-related brake control if certified | A brake output alone does not prove safe holding | Brake mechanics, diagnostic coverage and load test |
| SLS / controlled stopping | Application-specific safety functions if implemented | Not implied by two encoders or a fast current loop | Certified function scope and complete stopping-distance analysis |
| Thermal protection | May protect electronics or the motor | Ordinary NTC foldback is not a SIL/PL claim | Sensor coverage, thresholds, fault behavior and certification if required |
For gravity axes, evaluate mechanical holding and stopping behavior separately. Electrical servicing also requires the appropriate isolation and discharge procedure. Manufacturer safety manuals apply to their named products and configurations. [sto] Danfoss Safe Torque Off Operating Guide (03/2021)
Hypothetical calculations using the same model and presets as the tool, not customer deployments or measured performance. No precision, mass-saving or medical-use outcome is claimed.
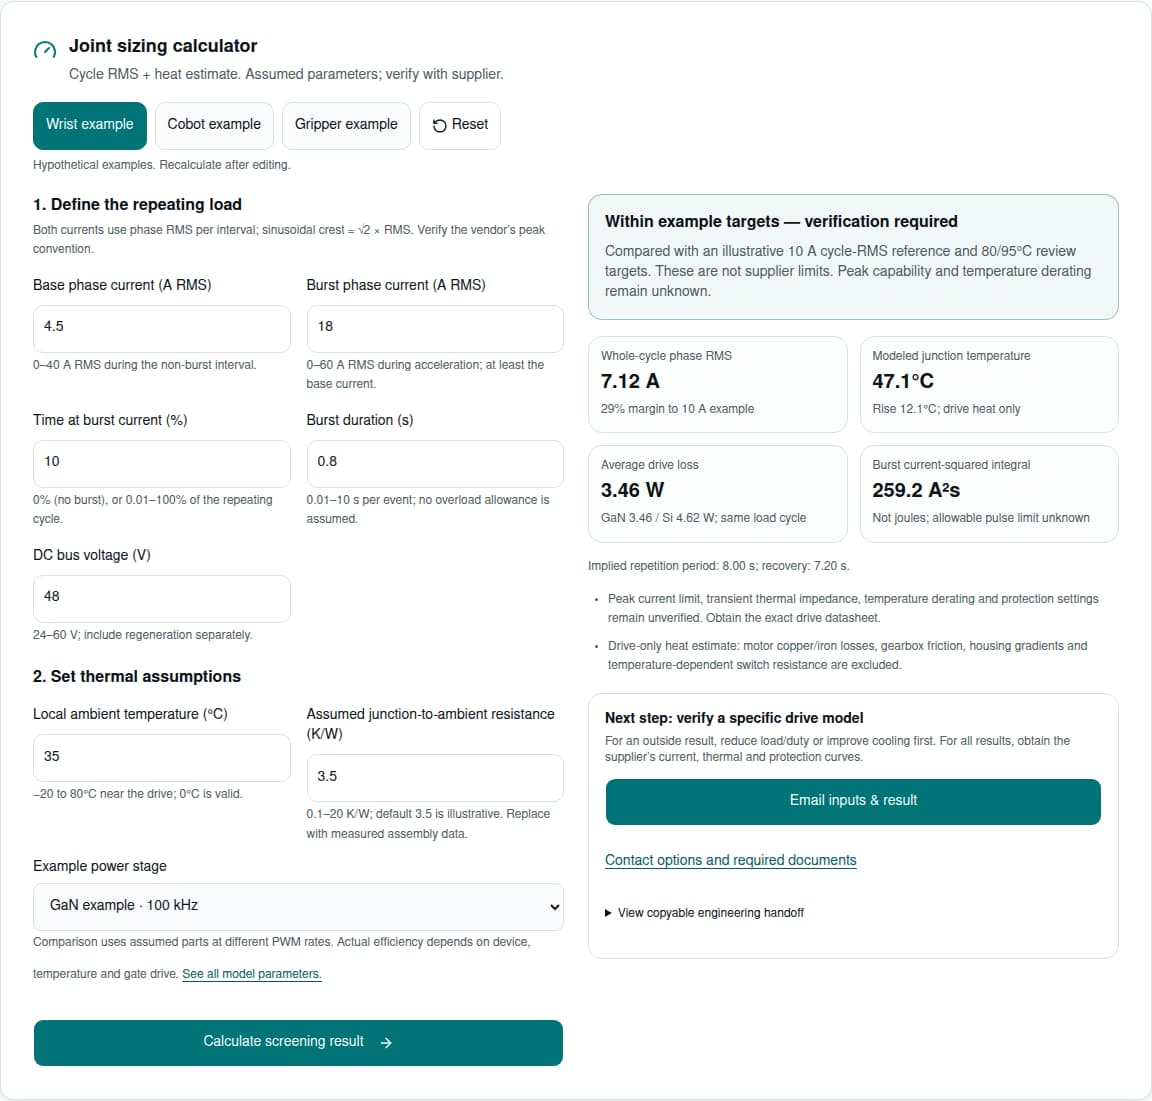
Inputs: 48 V; base 4.5 A RMS; burst 18 A RMS for 0.8 s at 10% duty; ambient 35°C; Rθ 3.5 K/W; GaN example.
Process: time-weight the squared current, calculate average inverter heat, then apply the assumed thermal resistance.
Result: 7.12 A cycle RMS; 3.46 W drive loss; 47.1°C modeled junction temperature.
Decision: Within the example reference. Obtain overload/derating curves and test the assembled joint.
Load this example using its preset aboveInputs: 48 V; base 7.5 A RMS; burst 22 A RMS for 1.5 s at 55% duty; ambient 40°C; Rθ 3.5 K/W; GaN example.
Process: time-weight the squared current, calculate average inverter heat, then apply the assumed thermal resistance.
Result: 17.07 A cycle RMS; 13.52 W drive loss; 87.3°C modeled junction temperature.
Decision: Outside the example reference. Reduce burst duty/current or evaluate a larger drive and better cooling.
Load this example using its preset aboveInputs: 24 V; base 3 A RMS; burst 12 A RMS for 0.4 s at 20% duty; ambient 30°C; Rθ 8.5 K/W; GaN example.
Process: time-weight the squared current, calculate average inverter heat, then apply the assumed thermal resistance.
Result: 6.00 A cycle RMS; 2.44 W drive loss; 50.8°C modeled junction temperature.
Decision: Within the example reference. Obtain overload/derating curves and test the assembled joint.
Load this example using its preset aboveA 10 A class drive is a candidate only when measured cycle demand, overload, voltage-speed margin and cooling match the actual rated envelope. A wrist, gripper or neck label does not by itself establish fit. For sustained demand above the derated rating, evaluate a larger current class, a revised motion cycle or a different motor/gear ratio.
On smaller screens, scroll the table horizontally.
| Risk | Trigger / uncertainty | Mitigation or alternative | Acceptance evidence |
|---|---|---|---|
| Repeating overload / misuse | Cycle RMS exceeds the real derated rating | Reduce acceleration/duty, add recovery or select higher current | Re-run the measured motion profile with manufacturer curves |
| Sealed-joint heating | Interface resistance and adjacent motor/gear heat | Improve housing contact, lower load or relocate the drive | Thermal soak in the closed assembly at worst ambient |
| Low-inductance mismatch | PWM ripple, sampling limits or motor overheating | Tune PWM, evaluate filtering or choose another winding/drive | Measure current waveform and motor temperature over speed/load |
| Regenerative surge | Supply cannot absorb simultaneous joint braking | Size a compatible sink, capacitor bank and/or brake resistor | Worst-case deceleration and power-loss energy test |
| Resonance / encoder EMI | Flexible gear and high dv/dt disturb feedback | Tune loops, routing and shielding; evaluate a slower edge rate | Loaded stability, CRC faults and EMC testing |
| Integration cost | Custom board, thermal fixture, safety and firmware work | Compare total prototype/validation cost with standard modules | Ask for NRE, MOQ, lead time and test deliverables separately |
Direct-mains drives, high-impact leg axes and safety-critical medical mechanisms need additional requirements beyond this low-voltage screening tool. Compare the total cost of custom packaging and validation with a standard module before commissioning a bespoke board.
If the profile is unknown, start by logging one representative and one worst-case cycle on the existing actuator. If the thermal path is unknown, supply housing CAD and material/contact details for review. These are the minimum useful inputs before relying on a calculated temperature.
Reviewed 2026-10-27. The links below support the stated engineering principles within their scope. Calculator constants and worked examples are disclosed assumptions; none are supplier-verified GSD measurements. Standards names alone are not evidence of product conformity.
Publisher: GaN Servo Drives. Next review due 2027-04-27, or sooner if a model assumption, cited document or available interface changes.
pp. 2–3 and 10: reference inverter architecture and a 48 V / 100 kHz test with 50 ns deadtime. This is an EPC demonstration board, not a GSD product or proof of the calculator parameters.
pp. 22 and 35, sections 3.3.5 and 4.2: torque–torsion behavior and K1/K2/K3 stiffness regions. Values apply to named gear units; they do not establish a complete joint’s accuracy.
Sections 1.3 and 2.3–2.4 explain torque inhibition, coasting, gravity-load protection and electrical isolation limits. Its certification applies to its listed products and configurations.
Distributed clocks synchronize device actions. Clock synchronization accuracy differs from controller cycle time and closed-loop response; confirm both for the selected hardware. Undated web overview.
CiA 402 parts 1–3 define drive behavior, modes and PDO mapping; CiA 1301 concerns CANopen FD. A CAN FD transceiver alone does not establish a motion profile. Catalog entries dated 2023–2024; full specifications may require membership/login.
Separates capacitor energy absorption, resistor continuous power, maximum short-term energy and recovery time. Use the proposed drive’s thresholds and resistor data. Undated online manual.
Still model-specific: available peak current, overload recovery, hot loss maps, supported encoder/fieldbus options, actual board dimensions, lubricant limits, thermal resistance, safety certificates and commercial availability. Obtain written confirmation and test data before product selection.
The label alone is insufficient. This calculator uses phase RMS for both base and burst intervals. Confirm whether the vendor quotes phase RMS, sinusoidal crest, or supply current, plus the applicable cooling conditions.
A repeating burst contributes to the full-cycle RMS. With 18 A RMS bursts at 30% duty, √(0.7 × 4.5² + 0.3 × 18²) = 10.55 A. The base interval alone cannot establish continuous suitability.
Unknown without the model-specific overload curve, current convention, initial temperature and recovery time. This tool does not assume that a 10 A drive can deliver 30 A or use a universal 900 A²s allowance.
At equal electrical input power, ideal DC supply current halves. Motor phase current for the same torque is set by the torque constant and its current convention; it does not automatically halve. Voltage also affects achievable speed and modulation headroom.
No universal percentage applies. Compare complete inverters at the same operating point. The example stages use assumed resistance, switching timing and auxiliary losses at different PWM frequencies; actual layouts and hot device behavior can change the result.
A lumped junction-to-local-ambient resistance for the complete drive cooling path, in K/W. The 3.5 K/W default is hypothetical, not a measured housing property. Replace it with assembly-specific data and measure the final joint.
No. They are illustrative review targets for this screening model. Semiconductor junction limits, PCB ratings, motor insulation, lubricant and accessible housing temperatures have different limits in their own documentation.
No. It estimates drive conduction, simplified switching/recovery and auxiliary loss only. Motor copper/iron loss, gearbox friction, housing gradients and transient thermal impedance require separate analysis and a thermal-soak test.
It measures output-side angle and enables corrective control. Mechanical compliance and resonance remain; achieved accuracy depends on calibration, load, bandwidth and stable tuning. Use the selected gear’s torque–torsion data [gear].
No. Inductance alone is insufficient. Check PWM, bus voltage, modulation, current sensing, motor speed and allowed ripple. The simplified 48 V / 25 µH example gives 24 A peak-to-peak at 20 kHz and 4.8 A at 100 kHz, not a compatibility guarantee.
No. PWM frequency, sampling rate, current-loop update and closed-loop bandwidth are different quantities. Ask for the actual control rates and measured loop response rather than inferring them from switching frequency.
Choose using the real bore, connector clearances, insulation, thermal contact, mounting stress and service access. Obtain the exact STEP file before committing the housing design; no universal diameter or mass follows from a 10 A rating.
No. No GSD model-specific safety certificate or reaction time is established here. Request the exact hardware/firmware variant, certificate and safety manual; assess the complete machine safety function.
Neither. Torque inhibition can leave a load coasting or moving under gravity, and the bus can remain energized [sto]. Assess stopping, mechanical holding and electrical isolation separately for the application.
No. Confirm whether the proposed drive includes one, its thresholds and its approved resistor. Check both pulse energy and average dissipation; a small DC-link capacitor is not a substitute for an energy budget [regen].
No. A transport capability does not establish the motion profile or timing. Verify the supported modes, mapping, bitrate, network load, synchronization and firmware documentation [cia].
Share the motor datasheet, measured motion cycle, housing CAD and required interfaces. Request the proposed variant’s current/thermal curves, protection behavior and safety documentation. Use the calculator’s email handoff to include its inputs and result, or copy the handoff text if an email application is unavailable.
Engineering inquiry
Contact on WhatsApp